Dashboard
Once your service has recorded traffic you can start a replay with the "Replay traffic" button from the traffic viewer, which will start the replay wizard.

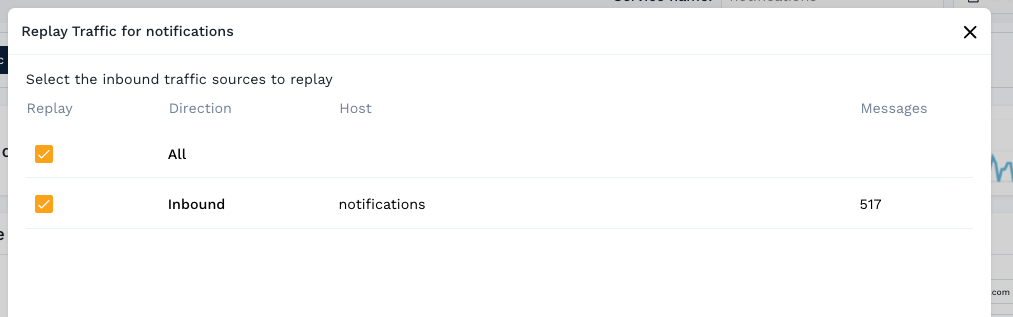
Follow the instructions in the wizard to select inbound traffic, the requests to be replayed against your service
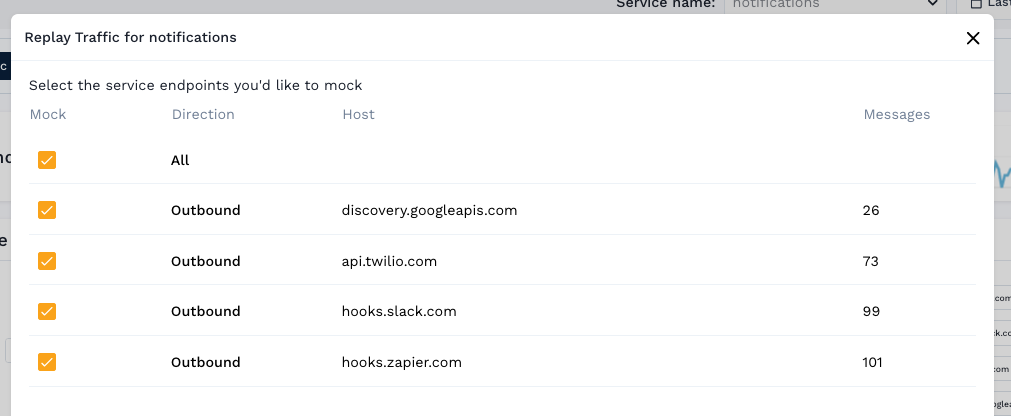
and outbound traffic, the endpoints Speedscale will mock and respond to instead of making requests to your real dependencies.
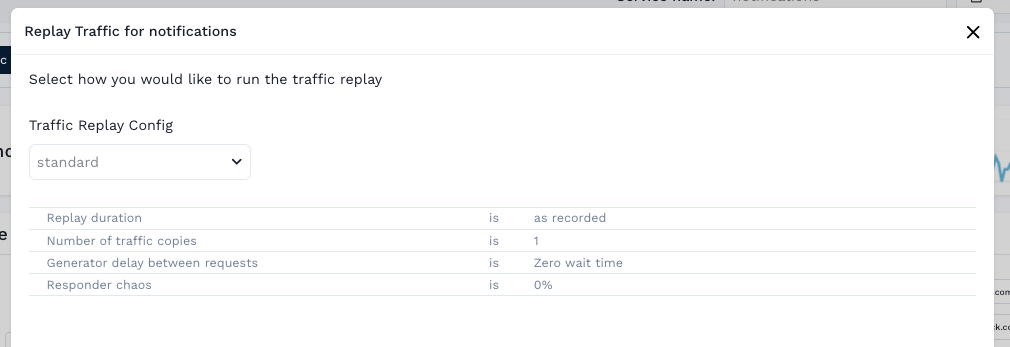
The replay config controls how the replay will be run. If you are unsure "standard" is a good default.
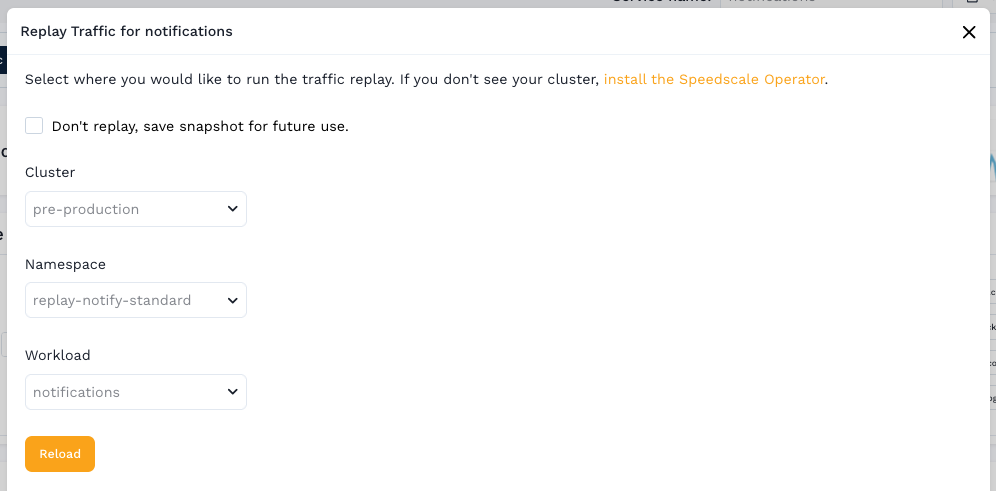
And finally select where the replay will run in your environment. Choose a cluster, namespace, and workload where a copy of your service is running. This may be the workload where the traffic was recorded, or a newer version of the same application you want to test against.
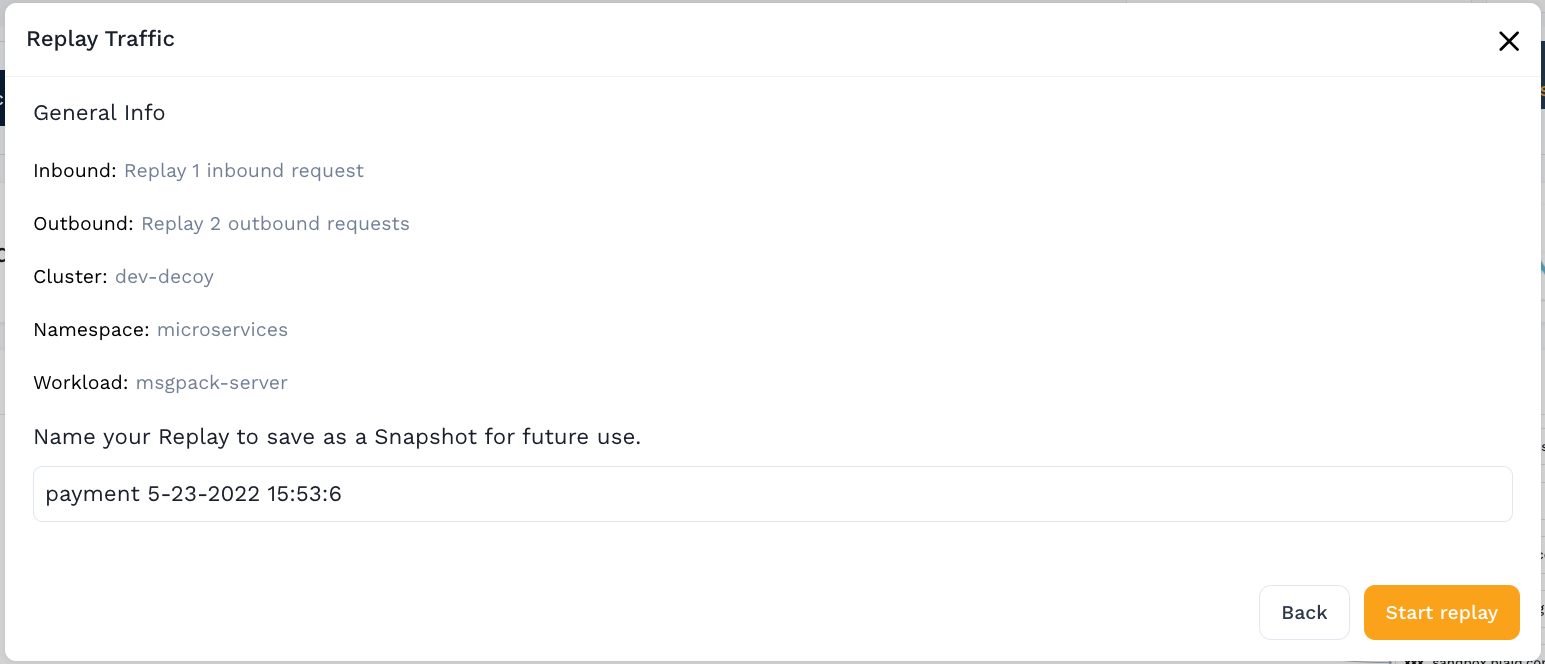
In the final step confirm your choices and optionally name the snapshot. The snapshot can be used to run the same replay later.
Replay traffic your service sent
By default a replay sends your service's inbound traffic to it and mocks everything it calls. To test a dependency instead, such as the database your service uses, open the snapshot and choose Choose replay tests from its actions menu. Pick the dependency under Outbound dependencies and save. The snapshot is reanalyzed and the dependency becomes a service you can replay against. See Choose What a Replay Tests, PostgreSQL Load and Regression Testing and MySQL Load and Regression Testing.
View Report
Once the replay is started you will be redirected to the replay report. The page will automatically update as the report is run, eventually showing a summary of the replay.
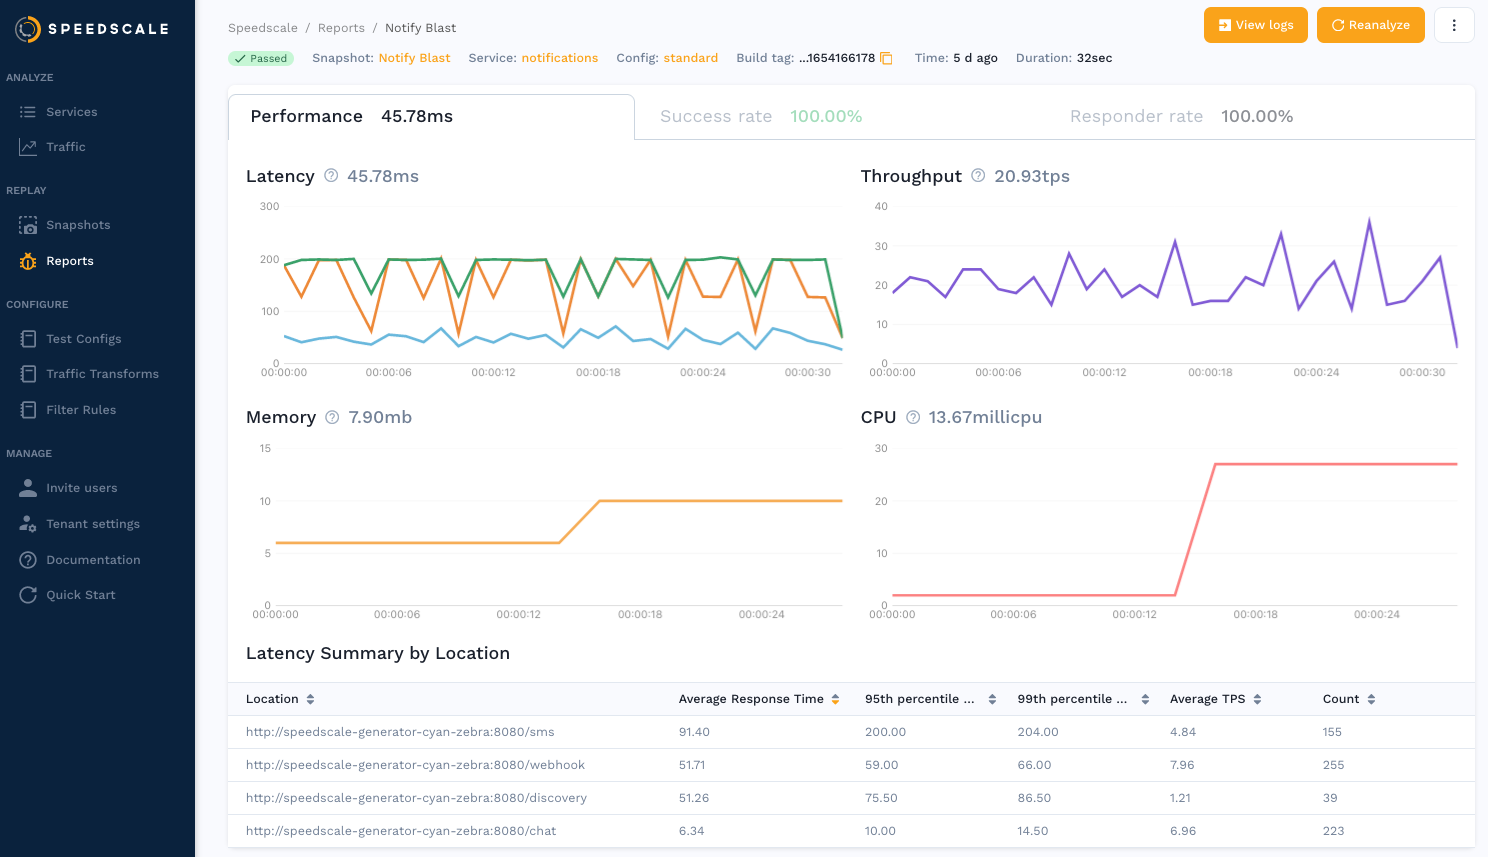
You can also access the report later from the reports page.