Chaos Engineering (API)
Chaos Engineering means designing experiments to ensure that your service will tolerate failures adequately. This term was popularized by Netflix in the early 2010's and was initially focused on experiments involving infrastructure failures like network latency or server failure.
Speedscale introduces chaos at the API level by manipulating individual request response times, status codes and data patterns. For example, Speedscale service mocks can automatically slow down an occasional transaction (versus an entire network connection) or produce an occasional error at random. This is the type of behavior commonly seen when using 3rd party APIs over the internet. Running a chaos oriented test in addition to a stress test provides an extra level of safety for a new build of your code.
The Speedscale chaos approach is complementary to infrastructure experiments provided by tools like Gremlin or Chaos Monkey.
Combine chaos with endpoint load
Endpoint and session load plans choose which traffic starts and when; chaos rules change request behavior. For example, ramp statement traffic and fail its dependency while keeping transaction posting steady, then remove chaos and check recovery. The banking how-to includes an executable scoped dependency-failure test.
Scoped chaos rules
A chaos rule is three things: what traffic it applies to, how often it fires, and what it does.
--chaos '(url CONTAINS "/v1/inventory"): status=503,percent=100'
Rules are evaluated in order and the first match wins: one rule applies per response. The effects within that rule all apply.
Chaos is injected by the responder into the responses it serves for your application's outbound dependencies. It does not touch inbound traffic, and it is HTTP-only today: a rule whose scope selects gRPC or SQL traffic logs that it matched nothing rather than silently doing nothing.
Scope
The scope is a filter query, using the same syntax as --query-string and the Filters dialog. Every group must be parenthesized, which is the most common thing to get wrong:
(url CONTAINS "/v1/inventory")
(host IS "api.stripe.com") AND (command IS "POST")
(location REGEX "^/api/checkout")
* matches everything.
Useful fields: url, location, host, command, status, header[Name], query_param[name], tag[key]. Operators: IS, CONTAINS, NOT, NOT CONTAINS, REGEX.
A scope that matches nothing is the most common chaos misconfiguration, so per-rule hit counts are reported during and after a run (see Seeing what happened). If a rule shows zero hits, the scope is the first thing to check.
Effects
| Effect | Values | Notes |
|---|---|---|
latency | 2s, 3x, 100ms-2s | Fixed, a multiple of the recorded latency, or a jitter range |
status | 500, 503, … | Replaces the status the client receives |
connection | refuse, reset, stall, drop | Breaks the connection; drop cuts mid-response |
body | corrupt, truncate, truncate:<bytes> | Invalid JSON, or a well-formed shorter body |
header | Name:Value | Adds or sets a response header |
no-response | (takes no value) | Ends the exchange with no reply at all |
payload | (takes no value) | Perturbs one field inside the body; see below |
Effects compose. latency=2s,status=503 does both.
Payload chaos
Every effect above damages the response as a whole. payload is the one that reaches inside it: the difference between this endpoint returns 500 and this endpoint returns a null where the client assumes a number. The second is the failure that survives review, because the status is 200 and the contract still looks satisfied.
It has no --chaos string form and is not in the rule editor yet, so it is written directly into chaos.json or the test config:
{
  "id": "inventory-null-count",
  "name": "inventory returns null availability",
  "percent": 100,
  "scope": {"operator": "AND", "conditions": [{"operator": "AND", "filters": [
    {"include": true, "operator": "CONTAINS", "optUrl": "/v1/inventory"}]}]},
  "effects": [{
    "payload": {
      "extractor": {"type": "json_path", "config": {"path": "http.res.bodyBase64.available"}},
      "perturbation": "PERTURBATION_NULL"
    }
  }]
}
The extractor is the ordinary extractor vocabulary, so any json_path that addresses http.res.bodyBase64. works. Perturbations are PERTURBATION_NULL, PERTURBATION_FUZZ_NUMBER, PERTURBATION_FUZZ_STRING, PERTURBATION_TYPE_FLIP (a number becomes the string of it), PERTURBATION_DELETE_KEY, and PERTURBATION_TRANSFORMS to apply a transform chain instead.
Two deliberate limits. Requests are never perturbed: the responder is mocking a dependency, and the request is your application's own output, not something chaos is entitled to damage. And a path that descends into JSON embedded in a JSON string is refused rather than skipped, because a payload effect that quietly perturbs nothing is worse than one that errors: the marker would still claim effect=payload and the run would look like it had tested something.
Knobs
| Knob | Meaning |
|---|---|
percent= | Chance the rule fires at all, 0–100 |
seed= | Makes the run reproducible; see below |
sticky | Every occurrence of a signature shares one verdict |
max-latency= | Lowers the delay ceiling for this rule |
start-after= | How far into the run the rule becomes active |
duration= | How long it stays active once it opens |
@<percent> | Suffix on an effect, giving it its own probability |
@<percent> is Toxiproxy's toxicity, not a selection weight. latency=2s@50,status=503 fires the status every time the rule matches and the latency half of those times. The two are independent, so both can happen or only one.
Bounded windows
A rule with no window is active for the whole run. start-after and duration bound it:
--chaos '(url CONTAINS "/v1/inventory"): status=503,start-after=10s,duration=30s'
That is the difference between this endpoint is flaky and this dependency went down for 30 seconds and came back, the second being the shape a chaos hypothesis usually takes:
given inventory returns 200, when it returns 503 for 30 seconds, then the service retries and succeeds again once the window closes.
The window is measured from the start of the run, not from when a responder process started. The responder runs as multiple replicas in a cluster, and a per-process clock would open each pod's window at a different moment, smearing the disruption you are trying to observe cleanly.
A consequence worth knowing: if a run has no start time to anchor to, bounded rules do not fire rather than running for the whole run, and the responder says so. Giving you the entire run when you asked for thirty seconds would be the more damaging failure.
Windows are also the one place wall-clock enters an otherwise clock-free engine. A windowed run is reproducible in its verdicts (the Nth occurrence of a request gets the same answer) but not in its exact request membership, since which requests land inside the window varies with timing.
How a rule is selected and applied during a replay
Chaos is injected by the responder, at the moment it answers one of your application's outbound calls. The order of operations matters, because most surprises come from assuming it happens somewhere else in the pipeline.
Attaching rules to a run
There are three ways to hand rules to a run, and they all end up in the same place. The responder builds its engine from chaos.rules on the test config it was given, so that is the single mechanism; everything below is a way of getting rules onto it.
On the command line, for a local run. Repeat the flag for more than one rule:
proxymock mock --in ./proxymock/recording \
  --chaos '(url CONTAINS "/v1/inventory"): status=503,percent=100'
Saved in the workspace, for a local run you want to repeat. Rules authored in the Chaos Rules pane are written to proxymock/chaos.json and picked up by the next proxymock mock with no flag at all.
On the test config, for a replay in a cluster. Put the rules in the test config that the TrafficReplay names, and every replay using that config runs with them:
apiVersion: speedscale.com/v1
kind: TrafficReplay
metadata:
  name: test-1
spec:
  snapshotID: abf5c088-48f2-43a6-bf59-8b12f04144b4
  testConfigID: chaos-inventory-down   # a test config carrying chaos.rules
  workloadRef:
    kind: Deployment
    name: my-app
Keeping chaos on the test config rather than on the replay is what makes a chaos run repeatable and shareable: the same testConfigID is the same experiment, and the CI pipeline that already passes a test config ID needs no new plumbing to run one.
If more than one source applies to the same local run, the order is --chaos first, then the saved chaos.json, then whatever the test config already carried. Because the engine is first-match-wins, that ordering is the precedence: the most explicit and most ephemeral rules get first refusal on the traffic.
Rules with no seed= of their own inherit the test config ID as their seed, so two replays of the same test config make the same decisions without anyone configuring reproducibility.
Rules are read once, when the run starts, and are fixed for its lifetime. Editing them in proxymock-web does not change a run already in progress.
Chaos runs on the mock-hit path, after matching. The request is matched against recorded traffic first, and the engine is only consulted once a recorded pair has been found. A perturbed response is therefore always a mock hit and never a miss: chaos never invents a response for traffic the mock did not recognize. This is why the Chaos column and the Match column agree in the Requests grid, and why injected failures cannot inflate your no-match rate.
The scope is matched against the live request plus the response about to be sent. Request-side predicates (url, header, query_param) see the actual incoming request, and response-side predicates (status) see the recorded response. Both mean what you would expect.
First match wins, including when the roll declines. The first rule whose window is open and whose scope matches claims the request. If that rule's percent roll then says no, the response goes out untouched and evaluation stops there rather than falling through to later rules. So a percent=50 rule at the top does not leave the other half of the traffic for the rule below it, it leaves that half unperturbed. This is what the preview calls shadowed.
The roll is keyed, not random. It is an fnv64a hash over the seed, the rule id, the request signature, the occurrence count, and the effect index, with no clock in it. That is what makes the Nth call to a given endpoint always get the same verdict. The occurrence counter lives in the responder process, per rule and signature, so it keeps incrementing across every request the run sends. sticky skips the counter so all occurrences of a signature share one verdict, and a @<percent> toxicity suffix rolls independently per effect by mixing the effect index into the key.
Effects apply before the body is encoded. Payload effects have to perturb the body while it is still structured, so the engine runs ahead of encoding and the marker is attached last. The engine is consulted exactly once per response: asking twice would advance the occurrence counter and give the two questions different answers.
One thing that is deliberately not chaos: the responder's own baseline response delay. That is applied whether or not a rule fires, and a latency effect adjusts it rather than replacing it.
Building rules in proxymock-web
Chaos Rules, under Overrides in the left sidebar, edits the rule set without hand-writing JSON. It sits beside Blueprints because the two are the same kind of thing: a declaration saved into the workspace that changes what the next run does, without altering the recorded traffic. The rule editors under Config are machine-global by contrast, and travel with your install rather than your workspace.
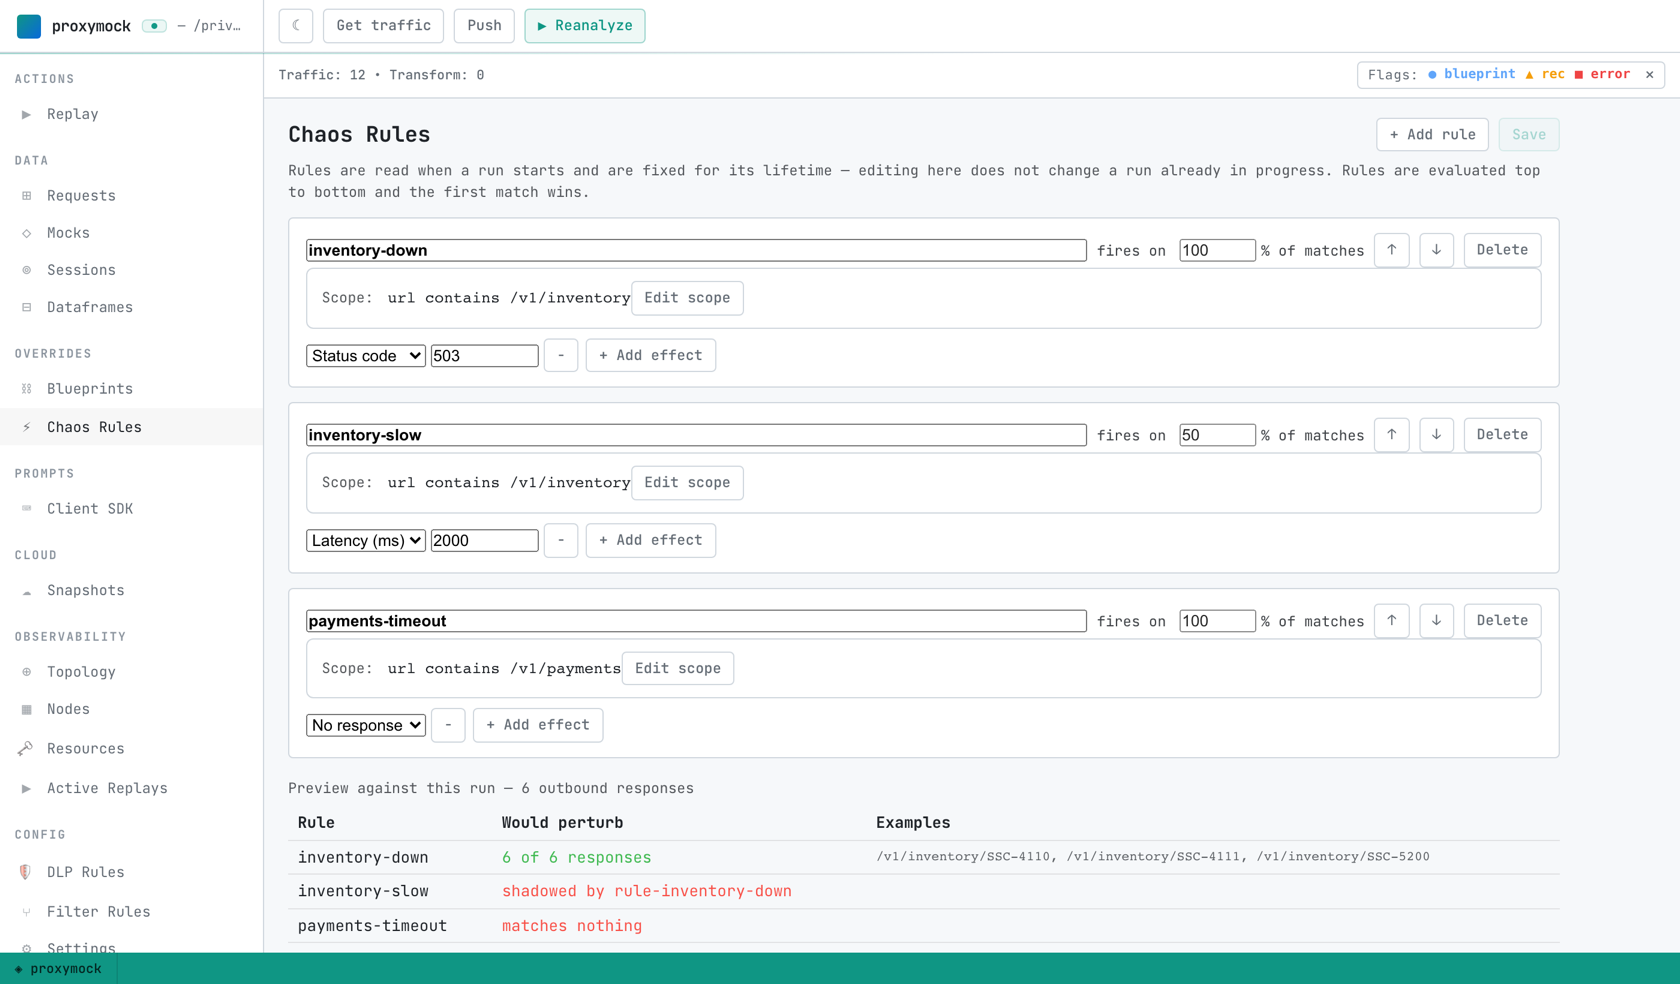
Each rule is a name, a scope, a fires on percentage, and one or more effects. The arrows reorder rules, which matters because evaluation is top to bottom and the first match wins.
Rules are saved to proxymock/chaos.json in the workspace and are picked up by the next proxymock mock run. Keeping them beside the traffic is deliberate: a rule scoped to /v1/inventory means nothing in a workspace that has no inventory calls.
Scope is a filter
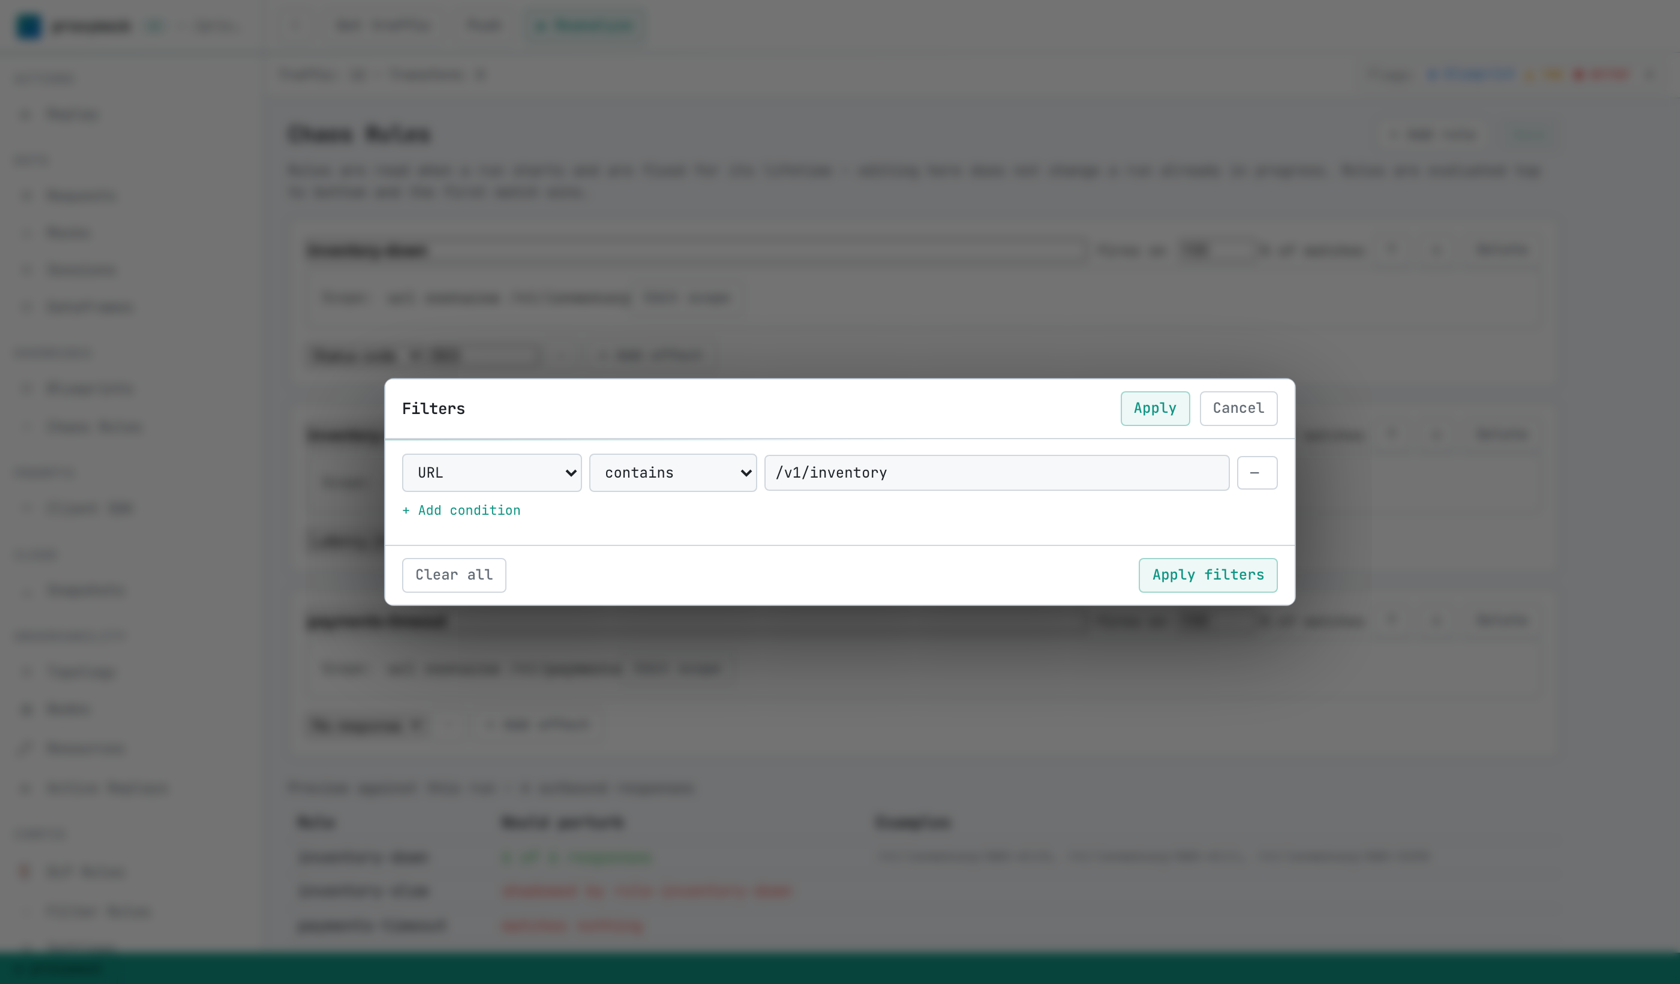
Edit scope opens the same Filters dialog the Requests grid uses, so a chaos scope and a grid filter are the same object. You can narrow the grid until it shows the traffic you want to break, then use that filter as the scope.
The preview is the point
Each rule is scored against the loaded traffic before you run anything. In the screenshot above, all three verdicts are visible at once:
| verdict | meaning |
|---|---|
6 of 6 responses | the rule works |
shadowed by <rule> | the scope is fine, but an earlier rule takes the traffic first |
matches nothing | the scope selects no traffic |
inventory-slow is shadowed because inventory-down sits above it with the same scope and takes the traffic first. payments-timeout matches nothing because this workspace has no /v1/payments calls in it.
Those last two look identical from a completed run (both produce zero markers), which is why the distinction lives here rather than in the report. Rules are evaluated top to bottom and the first match wins, so moving a rule up changes what every rule below it sees.
When a rule cannot fire
Two cases are reported rather than left silent, because the symptom of both is a rule that simply does nothing:
- at startup, a rule scoped to a technology chaos cannot inject into. v1 perturbs HTTP responses
only, so a rule scoped to
postgresis never even evaluated. - at the end of a run, any rule that matched no traffic. That is not necessarily a mistake (a rule scoped to an endpoint the run never called is legitimately quiet), but it is the first thing worth checking when chaos appears not to have worked.
Neither fails the run. A rule that cannot fire is a mistake; the rest of the rule set is probably doing what you wanted.
Seeing what happened
Every perturbed response carries a marker, both as the x-speedscale-chaos response header and as a tag on the recorded pair:
effect=status code;status=503;rule=inventory-down
Absence is the signal. There is no none value: an untouched response carries no marker at all, so a marker is always evidence that something was perturbed.
That marker drives:
- the Chaos column and the "chaos applied" filter in the proxymock-web Requests grid, and the chaos row in the RRPair detail view
- the Chaos summary at the top of the Report view: how much of the run was perturbed, by which rules, and with which effects
- the same pill and detail row in the Speedscale dashboard
One thing that looks wrong and is not: the recorded pair keeps its pre-chaos status. That pair is mock input for a later run, so rewriting it would change what a re-replay does. The grid shows the status the client actually received, with the recorded one alongside; status= in the marker is the authority on what was sent.
Reproducibility, and its limit
seed= makes a run repeatable, with a caveat worth stating plainly.
The roll is a pure function of the rule, the request signature, and the occurrence count, so the Nth lookup of a given request always gets the same verdict. It is not a promise that two runs are identical: a run that issues a different number of requests for a signature diverges after that point.
That is stronger than ordering-based reproducibility, which is worthless when the responder serves requests concurrently, and weaker than full determinism. In practice it means a failure you find this way is one you can hand to a teammate along with the command that produced it.
sticky trades the occurrence counter away: every occurrence of a signature shares one verdict, so "this exact request always fails", at the cost of being unable to express "35% of these calls are flaky".
Across multiple responder replicas
Each responder pod owns its own rule state and counters. percent therefore holds in aggregate across the run, not exactly per pod, and "the 3rd occurrence" means the 3rd that pod saw. A 3-pod replay at percent: 35 converges on 35% overall. Do not expect exact global counts.
What chaos does not do
It does not hide failures. If your application cannot absorb an injected failure, that failure is reported normally: in pass/fail, in error rates, and in the report outcome. Learning that the application is not resilient is the entire point.
Separately, chaos-affected traffic is excluded from drift, similarity and match-rate analysis, because an injected 503 is not mock drift. Those two rules are easy to confuse and point in opposite directions: chaosed pairs leave the analysis of how well your mocks match, and never leave the outcome of whether your application coped.
Behavior changes in Chaos v2
Chaos v2 replaces the original chaos implementation with a scoped rule engine. The corrections below are deliberate, but they change what an existing configuration does at runtime. If a chaos rate or effect mix looks different after upgrading, this is why.
Response delay is no longer capped at 5 seconds
This one affects every replay and mock run, including those with no chaos configured at all.
The responder previously capped any artificial wait at 5 seconds. That cap applied to the recorded latency itself, not just to injected delay, so a recording of a 30-second response replayed as a 5-second one, and a "very slow rogue transaction" never looked slow to a client whose timeout was longer than 5 seconds.
The ceiling is now the generator's requestTimeoutSeconds when the test config sets one, and 30 seconds otherwise, with a hard maximum of 60 seconds. An individual rule can lower it with maxLatencyMs. Runs whose recordings contain responses slower than 5 seconds will take longer than they used to.
Chaos fires at the configured percent, not one in a hundred more
The selection test was <= against a roll in [0, 99], so a rule fired percent + 1 times per hundred. The absolute error was always one request in a hundred, but the relative error was largest at low percentages: chaosPercent: 1 fired roughly twice as often as configured.
Every effect on a matched rule now applies
Enabling more than one of badStatusCodes, intermittentResponses and randomLatency previously cycled through them round-robin, so exactly one effect fired per chaosed transaction. Effects now compose, each gated by its own independent probability (toxicity), following Toxiproxy's toxic semantics.
An existing configuration folds into a single match-all rule whose effects each carry toxicity = 100/N, which preserves how often each effect fires on average. What changes is that the effects are now independent: two can fire on the same transaction, or none can.
Effect selection is seeded and reproducible
The 404-versus-500 choice and the factor-versus-fixed latency choice were both time.Now().UnixNano() % 2, which correlated with arrival time and made a run impossible to reproduce. Both are now derived from a seeded hash of the rule, request signature and occurrence.
One consequence is worth calling out: when a configuration sets both randomHighLatencyFactor and randomHighLatencyMs, the factor now always wins, where the old coin flip alternated between them.
X-Speedscale-Chaos: none is no longer emitted
An unchaosed response previously carried the header with the literal value none. Absence of the header is now the signal that nothing was applied. Anything matching on the string none must check for the header being absent instead.
The header is also richer when chaos did apply: it lists every effect and names the rule that fired, as effect=latency;effect=status code;rule=chaos-1. Readers should split on ;, parse key=value, and ignore keys they do not recognize.
intermittentResponses actually withholds a response
It never did before. The generator returned "no response" but the responder still wrote the reply, with the full recorded body and a status of 0, which net/http sends as 200 OK, silently downgrading a recorded 201 in the process. Anyone who believed they had tested their client's behavior against a dropped response had not.
The connection is now closed without a reply. Clients that were quietly succeeding against this will start seeing the failure it was always supposed to produce.
--fault is unchanged
The local --fault flag keeps its own rate=F/N counter, and overlapping --fault rules still merge their effects rather than resolving first-match-wins. Chaos rules use a seeded probability and first-match-wins ordering. The two selection models coexist deliberately for now; --fault compiling into the rule engine is tracked separately.